For a while, I’ve been wanting to explore deeper or “hack” into the internals of the BizTalk Databases, i.e. BizTalkMsgBox and BizTalkDTA. When do records gets stored in these database, how long do they stay there, and when do they get “cleaned-up”.
So here is my first scenario. I use a SQL command to Find out how many rows of each table in your BizTalk Databases (as per previous blog post).
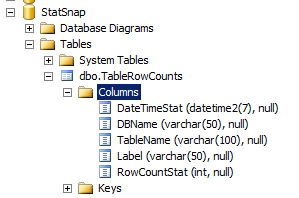
I modified the query to store the data in a statistics table that I created so that I could use queries to identify any differences. Here’s what that table looks like:
Now let me show you how I collected the data. I ran two queries, once against each of the two databases, captured the date/time to use the exact same time (for purposes of joining later) and store statistics. I change the label ‘Before’ to ‘During’ and ‘After’ later when I run the script again.
First run:
USE BizTalkMsgBoxDb

declare @WorkDateTime dateTime2 = getDate()
declare @Label varchar(15) = 'Test'
print @WorkDateTime
print @Label
insert into StatSnap.dbo.TableRowCounts
SELECT @WorkDateTime, 'BizTalkMsgDb', sc.name +'.'+ ta.name TableName , @Label, SUM(pa.rows) RowCnt
FROM sys.tables ta
INNER JOIN sys.partitions pa  ON pa.OBJECT_ID = ta.OBJECT_ID
INNER JOIN sys.schemas sc  ON ta.SCHEMA_ID = sc.schema_id
WHERE ta.is_ms_shipped = 0 AND pa.index_id IN (1,0)
GROUP BY sc.name,ta.name
ORDER BY SUM(pa.rows) DESC

USE BizTalkDTADb
insert into StatSnap.dbo.TableRowCounts
SELECT @WorkDateTime, 'BizTalkMsgDb', sc.name +'.'+ ta.name TableName , @Label, SUM(pa.rows) RowCnt
FROM sys.tables ta
INNER JOIN sys.partitions pa  ON pa.OBJECT_ID = ta.OBJECT_ID
INNER JOIN sys.schemas sc  ON ta.SCHEMA_ID = sc.schema_id
WHERE ta.is_ms_shipped = 0 AND pa.index_id IN (1,0)
GROUP BY sc.name,ta.name
ORDER BY SUM(pa.rows) DESC
Once the data is collected, the following query shows the which tables changed in size. I manually entered the date/times to match-up one specific earlier run from any later runs.
use statsnap
--truncate table TableRowCounts
--select * from TableRowCounts
select TRCBefore.DBName, TRCBefore.TableName,
    TRCBefore.Label, TRCBefore.RowCountStat,
    TRCDuring.Label, TRCDuring.RowCountStat,
    TRCAfter.Label, TRCAfter.RowCountStat,
    TRCLater.Label, TRCLater.RowCountStat
from TableRowCounts as TRCBefore
inner join TableRowCounts as TRCDuring on TRCBefore.DBname = TRCDuring.DBName and TRCBefore.TableName = TRCDuring.Tablename
inner join TableRowCounts as TRCAfter  on TRCBefore.DBname = TRCAfter.DBName and TRCBefore.TableName = TRCAfter.Tablename
where TRCBefore.DateTimeStat = '2015-01-27 09:16:42.2800000'
  and TRCDuring.DateTimeStat = '2015-01-27 09:19:55.6900000'
  and TRCAfter.DateTimeStat  = '2015-01-27 09:27:30.7900000'
  and (TRCBefore.RowCountStat != TRCDuring.RowCountStat
  or   TRCBefore.RowCountStat != TRCAfter.RowCountStat
  )
The resulting query combining all stats:

I created an orchestration that takes a simple messages from a file receive location, maps it, delays 3 minutes, then sends it to a file. I snapshot the stats ‘Before’ starting the orchestration, ‘During’ – while the 3 minute delay is happening, then again ‘After’ the orchestration has completed.
One of the most important columns is nState, the values are described in this StackOverflow post.
    1 : Started
    2 : Completed
    3 : Terminated
    4 : Suspended
    5 : ReadyToRun
    6 : Active
    8 : Dehydrated
    16: CompletedWithDiscardedMessages
    32: SuspendedNonResumable
    64: InBreakpoint
Instances table

It turns out that I had four suspended instances for a few weeks back, 2 not-resumeable (nstate=32), and 2 resumeable (nstate=4) . You can actually see the error messages in the nvcErrorDescription column. I terminated those, then ran the query again. After deleting them, the following remain. Note that one has nState = 8, which would be my dehydrated orchestration (in the 3 minute delay). By running the query frequently while the orchestration is running, you can watch the nState change from 2 to 8. Sometimes it stayed with the value of 2 the whole 3 minutes.

:Later, I dropped four different messages, causing 4 orchestration instances to start. Below you can see which GUIDs are the same, and one one change per instance

Surprises
BTS_Applications table
The bts_applications table contains hosts, not applications:

Host Tables
This was not a surprise to me, because I had seen it before, but someone new to the internal of the database might find it surprising. When you create a new “Host” using BizTalk Admin Console (or via Object Explorer, WMI, or Powershell Extensions), five SQL tables are created for each host.

As Expected

I will continue with more observations and details in Part 2.